
The Trilight Case Study
Executive Summary
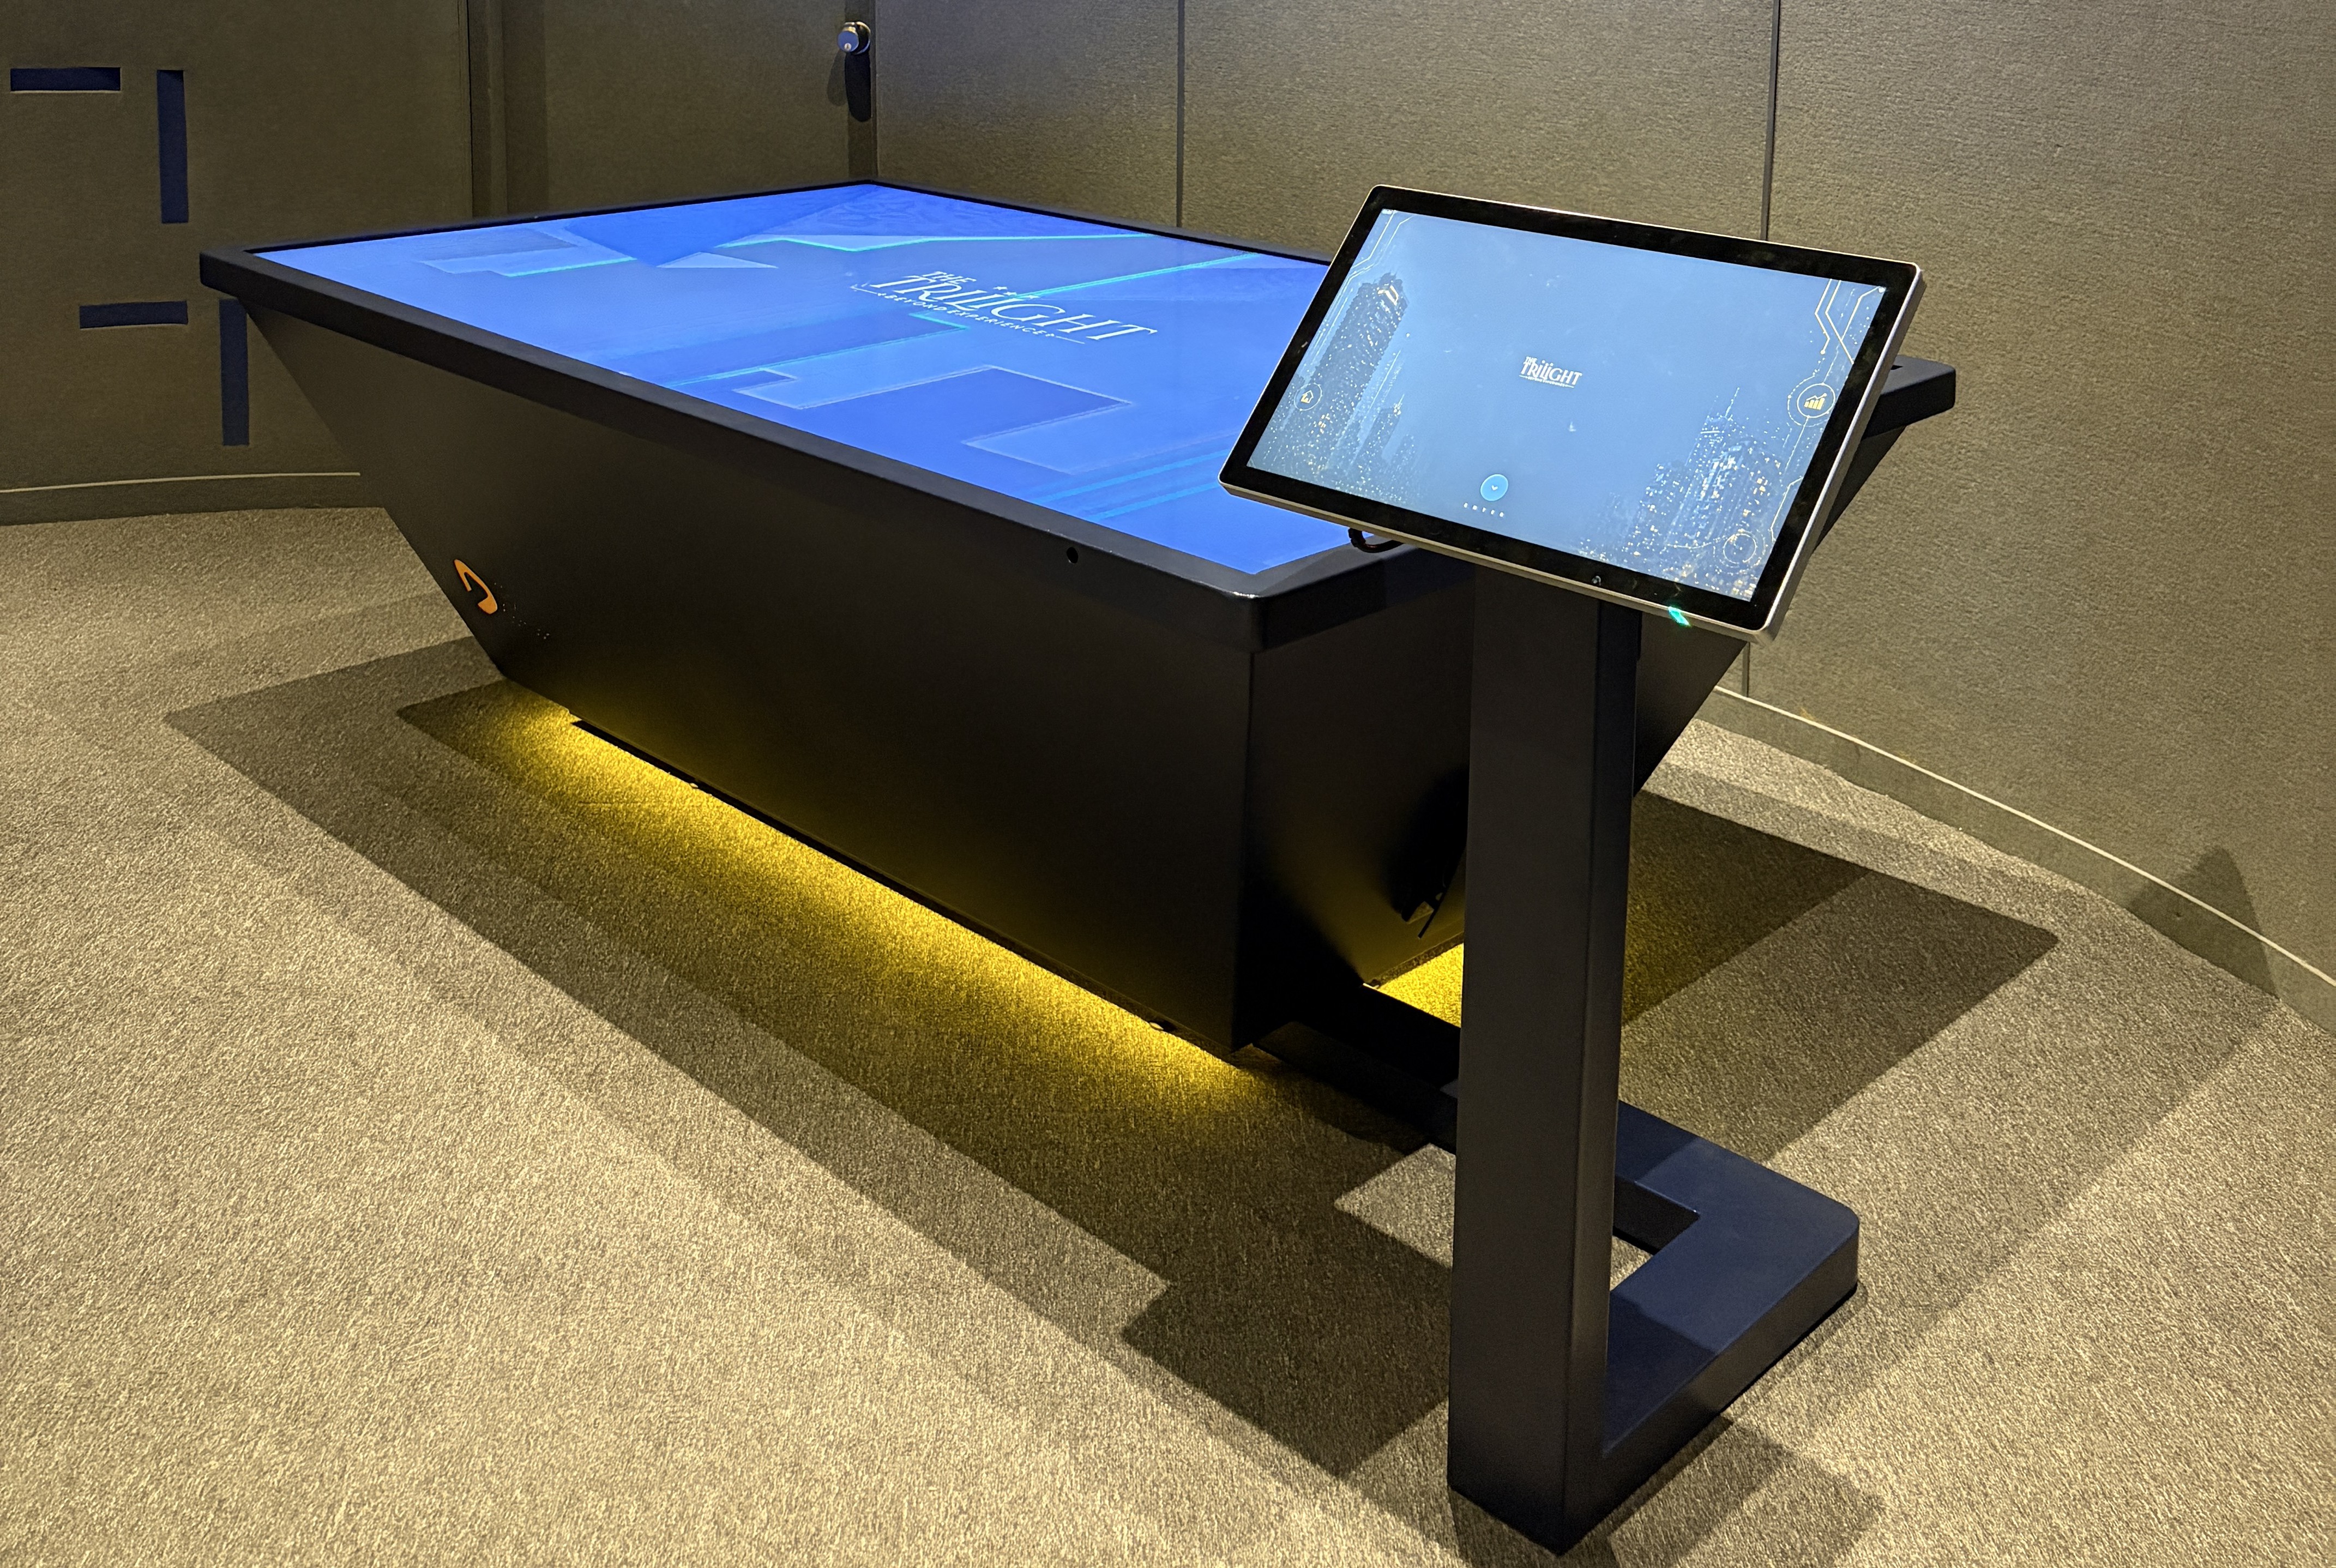
In Kokapet—Hyderabad’s premier high-rise and ultra-luxury residential micro-market—selling a high-end home requires communicating future urban development rather than just current surroundings. While conventional navigation platforms like Google Maps depict historical and existing infrastructure, they fail to showcase upcoming master plans. To solve this, The Trilight deployed our proprietary 100-Inch Interactive Exploration Table. Powered by high-performance NVIDIA graphics processing units and navigated via a precision tactile hardware controller, this platform maps future government Comprehensive Development Plans (CDPs), road widenings, transit links, and incoming Global Capability Centers (GCCs). Replacing static, single-use physical miniature models with a software-scalable digital display capable of hosting 10 to 12 projects simultaneously, the system turns complex master planning data into a high-converting, immersive sales experience.
Market Context & Geographical Landscape
Kokapet has established itself as the epicenter of luxury living and commercial expansion within the Greater Hyderabad region. Driven by proximity to the Financial District, Gachibowli, and the high-density Neopolis auction zone, the location attracts high-net-worth individuals (HNIs) and Fortune 500 executives. To match the architectural ambition of The Trilight, the sales narrative required a cutting-edge technological shift to showcase how surrounding commercial and social infrastructure will evolve over the next decade.
The Challenge: Beyond Static Mapping & Rigid Physical Models
- The Google Maps Limitation: Standard web mapping tools present historical geographic data and current road networks. They cannot layer unbuilt Development Plan (DP) roads, upcoming metro routes, or projected corporate parks.
- The Physical Model Trap: Traditional acrylic and plastic scale models occupy massive showroom floor space, represent only a single project phase, and cannot be updated as surrounding infrastructure develops. Obsolete physical models must be demolished and rebuilt at significant capital expense.
- Visualizing Quality of Life: Prospective buyers struggle to gauge how incoming Global Capability Centers (GCCs), IT parks, and civic amenities will impact daily traffic, commute times, and property appreciation without visual spatial context.
The Solution: 100-Inch NVIDIA-Powered Exploration Table
We engineered a custom interactive hardware and software ecosystem designed specifically for high-stakes real estate consultations:
1. Enterprise Hardware & Graphics Engine
- 100-Inch Ultra-HD Multi-Touch Surface: Provides a grand, architectural-grade visual canvas allowing multiple decision-makers to interact around the table simultaneously.
- NVIDIA Processing Power: Utilizes dedicated NVIDIA graphics hardware to render heavy 3D terrain, dense urban architecture, fluid particle maps, and high-frame-rate visual effects with zero latency.
- Precision Hardware Controller: Sales managers operate the table using a dedicated physical controller, providing fluid zoom, tilt, rotation, and smooth layer toggling during client presentations.
2. Advanced Spatial Data Layering
- Comprehensive Development Plans (CDPs): Integrates official HMDA zoning and future development maps, showing DP road widenings, flyovers, and green buffers.
- GCC & Office Corridor Mapping: Highlights incoming corporate towers and Global Capability Centers, demonstrating direct proximity to future employment hubs in Kokapet.
- Micro-Vicinity & Lifestyle Layering: Highlights nearby international schools, healthcare facilities, retail malls, and luxury dining precincts.
Key Value Pillars & Strategic Advantages
- Infinite Digital Scalability vs. Physical Waste: Unlike static miniature models, our interactive table features a multi-project digital architecture capable of storing and presenting 10 to 12 distinct projects or phase developments on a single table. When new towers are launched or surrounding infrastructure changes, updates are deployed seamlessly via software updates—eliminating physical demolition, material waste, and sales floor downtime.
- Substantial Increase in Dwell Time & Engagement: By replacing passive listening with hands-on, audio-visually rich exploration, buyers actively navigate the master plan. The interactive experience increases average customer dwell time by over 300%, providing sales leads ample opportunity to address buyer queries and showcase long-term value drivers.
Comparative Matrix: Sales Presentation Methodologies
| Feature / Capability | Traditional Physical Scale Model | Standard 2D Display Screen | The Trilight Interactive Exploration Table |
|---|---|---|---|
| Data Rendered | Static physical build of single project | Static images & non-interactive video loops | Future CDPs, DP roads, GCC hubs, 3D urban terrain |
| Graphics & Hardware Engine | None (Acrylic / Plastic) | Basic TV media player | Dedicated NVIDIA GPU processing unit & controller |
| Multi-Project Capacity | Strictly 1 project per model | Limited media folders | 10 to 12 projects on a single hardware footprint |
| Scalability & Updates | High cost (Destroy & Rebuild) | Manual file reloading | 100% Software-upgradable in real time |
| Customer Engagement & Dwell Time | Passive viewing (~5 minutes) | Moderate viewing (~10 minutes) | Active interactive exploration (25+ minutes) |